Introduction: Automation Needs More Than a Successful Launch
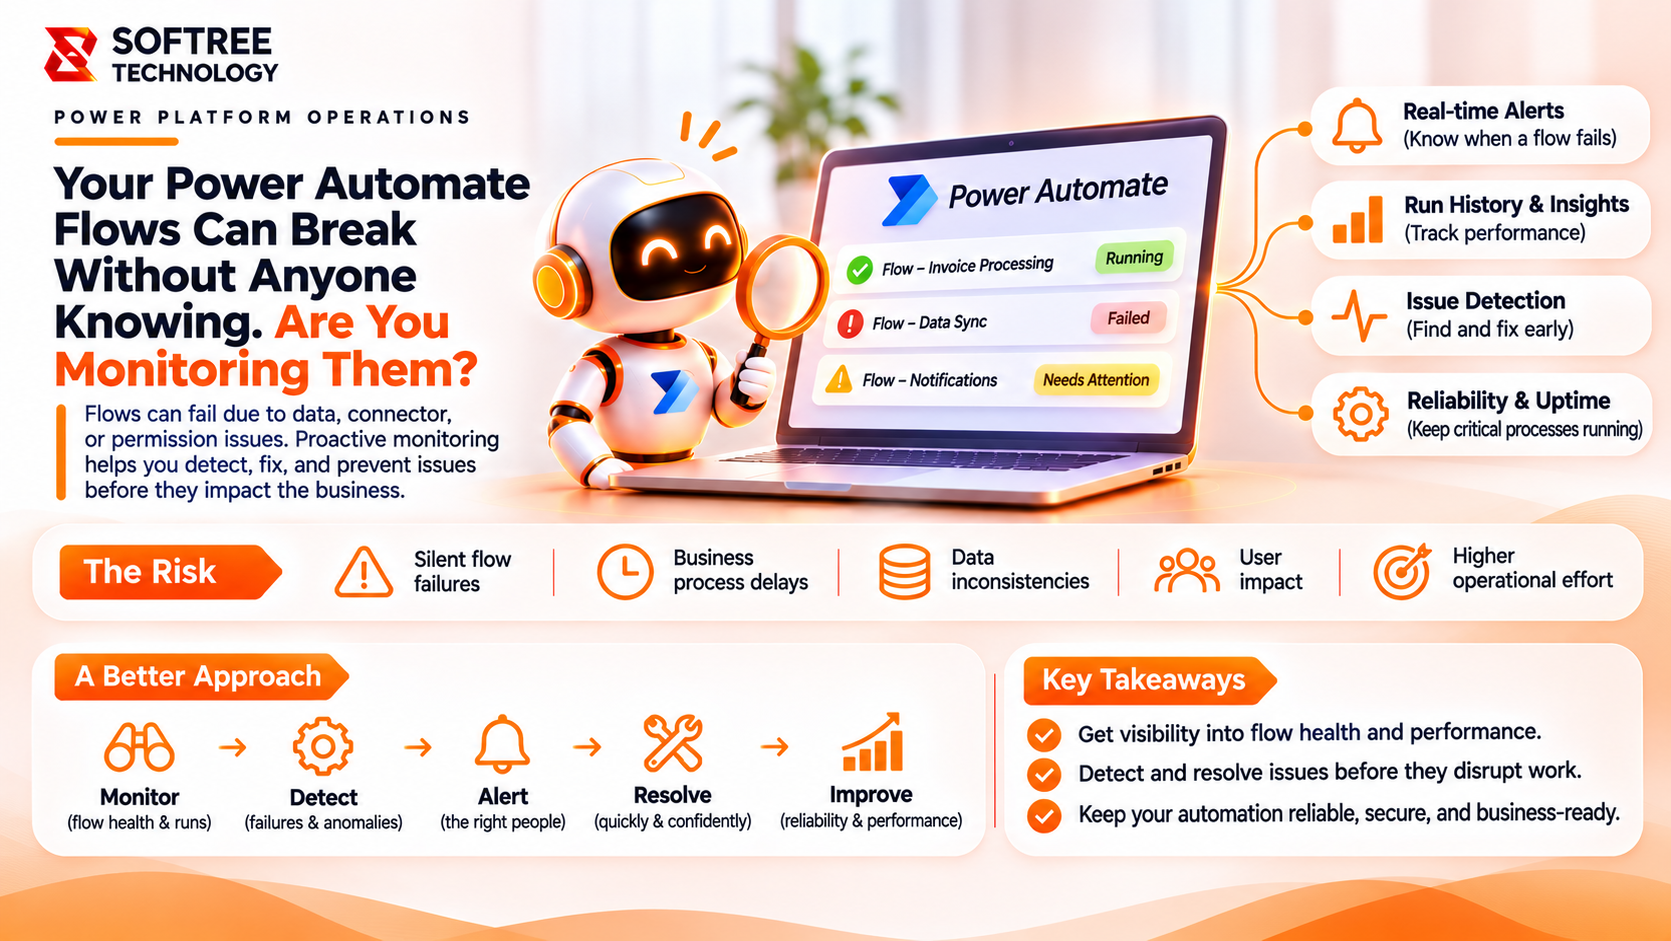
A Power Automate flow can run perfectly for months and then suddenly stop processing requests. A connection expires, a SharePoint column changes, an approval gets stuck, or an API starts returning errors. Meanwhile, employees continue waiting, business processes slow down, and nobody realizes that the automation has failed.
This is the risk of treating automation as a set-and-forget solution.
Building a flow is only the beginning. Businesses also need to know whether it is running, how reliably it performs, where failures occur, and who gets notified when something goes wrong.
That is where Power Automate monitoring becomes essential. With the right monitoring strategy, organizations can detect failures, investigate performance issues, and improve the reliability of business-critical workflows.
Key Takeaways
Power Automate monitoring tracks cloud flow executions, identifies failed or delayed runs, reviews performance, and alerts responsible teams when automation needs attention. Run history, flow analytics, Power Platform Monitor, Automation Center, Application Insights, and Dataverse can provide different levels of visibility. Effective monitoring should also identify workflows that stop running unexpectedly, even when no execution error is reported.
What We Learned
What Is Power Automate Monitoring?
Power Automate monitoring is the process of tracking flow executions, identifying failures or delays, reviewing performance, and receiving alerts when automation requires attention.
It can combine:
- Flow run history.
- Flow analytics.
- Power Platform admin center Monitor.
- Automation Center.
- Application Insights for supported telemetry configurations.
- Dataverse flow run records.
- Power Automate Management connector.
The objective is simple: identify problems before they become business disruptions.
How Power Automate Monitoring Works
A practical monitoring process follows five steps:
- Capture execution activity: Track flow runs, status, start time, duration, and relevant action details.
- Identify abnormal behavior: Look for failed or cancelled runs, unexpected execution times, and sudden drops in run volume.
- Investigate the cause: Inspect failed actions, connector responses, authentication issues, and trigger conditions.
- Notify the right people: Send actionable alerts to a responsible owner or shared support channel.
- Improve reliability: Fix recurring issues, review trends, and update monitoring rules as workflows change.
Individual flow run history helps makers investigate executions. Flow analytics provides performance summaries, while administrators can use the Power Platform admin center and Automation Center for broader operational visibility.
Architecture: How a Monitoring Solution Works
A monitoring architecture connects flow execution to centralized visibility, alerting, and incident handling.
Business Event or Schedule → Power Automate Flow → Actions and Connectors → Capture Run Information → Monitoring and Analysis → Failure or Anomaly Detection → Email or Teams Alert → Investigation and Recovery
Run information can be reviewed through flow history or collected into telemetry and logging systems such as Application Insights or Dataverse, depending on the implementation.
The monitoring layer should capture enough information to identify the affected flow, understand the failure, and determine who needs to respond.
Key Components of Power Automate Monitoring
Component
Role in Monitoring
Flow Run History
Shows individual executions, statuses, durations, and action-level details.
Flow Analytics
Summarizes run counts, success and failure rates, and execution duration.
Power Platform Admin Center Monitor
Provides operational metrics and recommendations across supported flows and environments.
Automation Center
Helps teams review runs, errors, process maps, and automation activity.
Power Automate Management Connector
Supports programmatic retrieval of flow metadata and run information.
Application Insights
Provides deeper telemetry, diagnostics, and custom alerting for supported configurations.
Dataverse FlowRun Records
Supports longer-term tracking and analysis of cloud flow execution history.
Real-World Example: Monitoring an Employee Approval Flow
Consider a company that uses Power Automate to process employee leave requests.
An employee submits a request through Power Apps. The flow records the request, sends it to a manager for approval, and updates the request status. If the approval action fails or the connection expires, the request might remain unprocessed.
A monitoring approach can make this process more reliable.
Example Workflow:
Employee Submits Leave Request → Power Apps Form → Power Automate Flow → Save Request in Dataverse → Send Manager Approval.
The workflow then follows two paths:
- Success: Update status and notify the employee.
- Failure: Capture error details, alert the support team, and investigate the issue.
The support team can review the failed run, inspect the action that caused the issue, and restore the connection or correct the configuration.
Monitoring should also check whether requests remain pending longer than the expected approval period. This helps identify situations where a flow technically runs but the business process still does not complete.
When Should You Use Power Automate Monitoring?
Monitoring is particularly important when:
- Flows support approvals, employee services, or customer-facing processes.
- Automations connect multiple systems or external APIs.
- A failure can delay payments, notifications, or operational tasks.
- Several teams depend on shared flows.
- Flows run frequently or process large volumes of business data.
- Your organization needs operational visibility and audit support.
For a simple, low-impact personal flow, basic run history may be sufficient. For business-critical workflows, use centralized monitoring, clear ownership, actionable alerts, and a defined recovery process.
Recommended Architecture for Production Monitoring
For production environments, monitoring should be designed as part of the automation solution rather than added only after a failure.
A production monitoring design should include:
- Centralized visibility for important flows.
- Failure notifications with flow name, run details, and error context.
- Monitoring for missing or unexpectedly delayed executions.
- Clear ownership and backup contacts.
- Connection and permission reviews.
- Retention and reporting appropriate to operational requirements.
- A documented process for investigating, retrying, and recovering failed work.
Not every flow needs every monitoring service. Select the tools based on the required level of visibility, scale, and governance.
Production Readiness Checklist
Business-critical flows have named owners.
Run history is reviewed regularly.
Failure notifications are configured.
Alerts reach a shared support channel where appropriate.
Trigger failures and missing executions are considered.
Connector authentication and permissions are reviewed.
Recurring errors and execution trends are analyzed.
Critical workflows have documented recovery procedures.
Monitoring data retention meets business requirements.
Monitoring rules are reviewed whenever flows change.
Key Takeaways: Reliability Requires Continuous Visibility
A flow that was successful at launch is not guaranteed to remain reliable.
Power Automate monitoring helps organizations detect failures, performance issues, and unusual execution patterns. Run history, analytics, Automation Center, and the Power Platform admin center provide different levels of visibility, while Application Insights and Dataverse can support deeper telemetry and longer-term analysis.
Critical workflows need actionable alerts, clear ownership, and recovery procedures. Monitoring should be part of production architecture from the beginning.
Downloadable Resource: Power Automate Monitoring and Reliability Blueprint
Planning to improve automation reliability? Use a monitoring blueprint to map critical flows, define ownership, identify failure signals, configure notifications, and document recovery procedures.
A useful blueprint should include:
- Flow inventory and business criticality.
- Monitoring metrics and expected execution patterns.
- Failure and delay alert rules.
- Escalation contacts and ownership.
- Troubleshooting and recovery steps.
Next Steps: Make Your Power Automate Workflows More Reliable
Reliable automation requires more than connecting triggers and actions. Businesses need workflows that are observable, maintainable, and aligned with operational requirements.
Softree Technology helps organizations build and improve Microsoft Power Platform solutions, including Power Automate workflows, Power Apps, and business process automation. From designing automation architecture to improving integrations, error handling, and monitoring strategies, the goal is to make business processes more dependable.
Want to make your Power Automate workflows more reliable? Connect with Softree Technology to explore how a structured monitoring and automation strategy can help your organization reduce disruption and improve operational visibility.
https://www.softreetechnology.com/